If you have seen certain reviewers out there, you may have noticed the use of measurement devices as well as graphs that relay the information gathered from test tones, like frequency response as well as maybe phase as well. These can help drive the narrative for a review, but it’s certainly not everything. However, they are helpful to explain their design philosophies somewhat. Certain more renowned publications have made a point to include such graphs, such as Stereophile, Sound & Vision, and even some from a publication you all might be, but one I’m certainly familiar with, Secrets of Home Theater and High Fidelity. As such I had taken about a day to get myself settled with the software, work out kinks as well as what is needed to set it up as well as work the software for future projects and review I may help out with, or for my own benefit.
As you can tell from the title, I worked with the free application for this matter, Room Equalization Wizard (REW). Unlike other free applications that I’ve actually worked with such as Audacity, Lightroom (video editing application) as well as Gimp, REW is actually rather polished, and very very complete for that is needed. For those out there who are not familiar with such room equalization applications, I shall explain what this application aims to do. As their website states, “REW is free room acoustics analysis software for measuring and analysing room and loudspeaker responses. The audio measurement and analysis features of REW help you optimise the acoustics of your listening room, studio or home theater and find the best locations for your speakers, subwoofers and listening position. It includes tools for generating audio test signals; measuring SPL and impedance; measuring frequency and impulse responses; measuring distortion; generating phase, group delay and spectral decay plots, waterfalls, spectrograms and energy-time curves; generating real time analyser (RTA) plots; calculating reverberation times; calculating Thiele-Small parameters; determining the frequencies and decay times of modal resonances; displaying equaliser responses and automatically adjusting the settings of parametric equalisers to counter the effects of room modes and adjust responses to match a target curve.”
I know that is a lot to take in, but in simpler terms, the application has the ability, provided you have the appropriate tools, to generate graphs for multiple audio measurement and analysis, which is the basis for room equalization, and other commercial room equalization softwares that do it for you in most receivers if you have the tool. One example that is pretty common in certain brands of receivers is the use of Audyssey Room Correction, with their included mic and setup software, which is almost plug and play, from personal previous experience. But one of the main features that I’m actually interested in in my use case in terms of reviewing is the fact that it has audio measurement and analysis features, to display said graphs I mentioned other reviewers are doing. This can provide a clearer and more detailed review of my future projects as well as allow me to provide a more complete review, up to the standards of more renowned publishers out there. I just need to understand what the graph means though.
What you’ll actually need for such audio measurement and analysis is actually quite a few pricier things, that if I didn’t have these in possession by chance in many ways, I wouldn’t have ability to proceed. For this work, I needed an audio interface, an integrated-amplifier-like item needed for microphone and recording, as well as a calibrated analog measurement microphone, or just a USB calibrated microphone. I had the earlier, by almost pure chance as well. The calibrated analog measurement microphone was courtesy of my dad, who had also asked me to look into such software for his own reviews as well, and because he has a servo Velodyne Subwoofer that came with a calibrated measurement microphone for it’s own calibration of the servo. I was able to use it for this software to work, because I had the audio interface as well.
From there you can just load up the software, and make sure you are selecting the correct input that the software recognizes as the input for it’s SPL meter (where it receives sound for measuring DB as well as the audio). I had an issue with that where it was recognizing a different input as the main and therefore the meter in the software was not picking anything up. I’ll need to figure out how to switch the input it’s listening to since my interface has 2 inputs, so for the moment I just need to use the other input (which is actually labelled as input 2) for this software. You’ll also need to calibrate it with your own SPL meter which my dad happened to have in hand as well. Turns out you’ll need quite a few things for this software if you are going down my route. As for the set-up, for specifically recording frequency response from a speaker, you can place your mic in front of the speaker, like about a meter or a feet or so, on a stand depending on the height you’ll need, and recording the sweep in the next step.
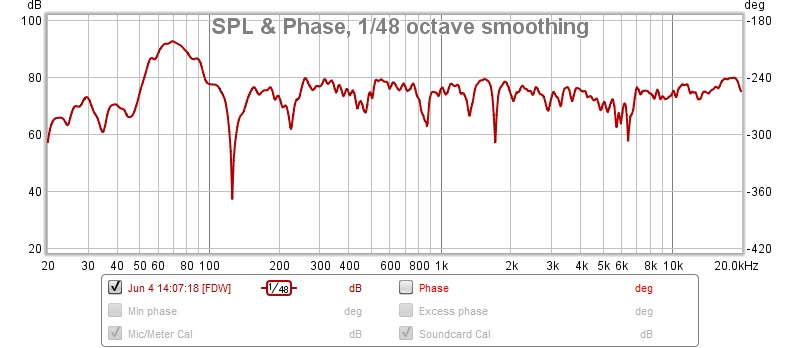
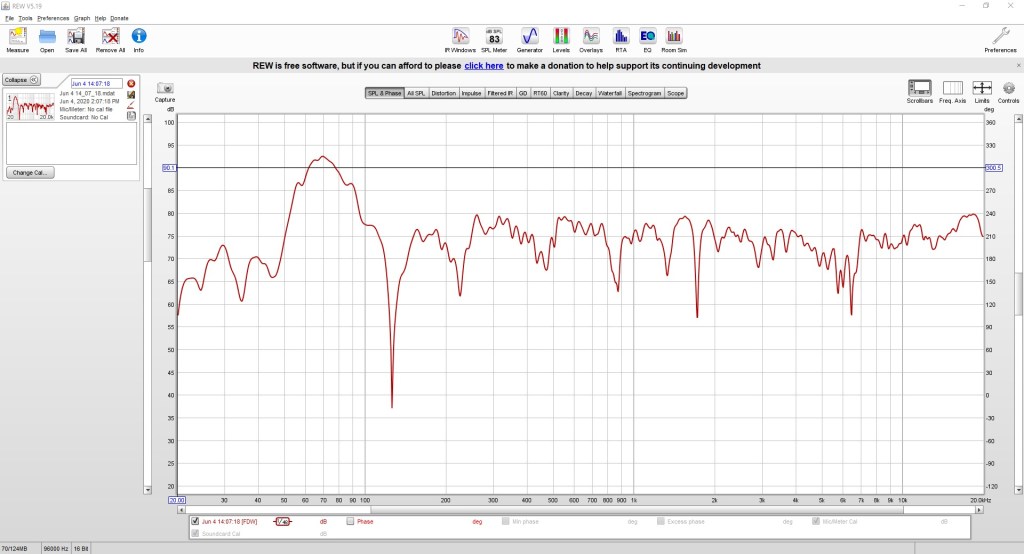
Once you have gone into the SPL meter in the software and calibrated it, you can start measuring with the software by clicking on the measuring button. You’ll then set what frequencies you are measuring as well as how long you want it to measure by adjusting the length of the frequency how many times it repeats the sweep. What you get next is a graph of the frequencies you set that is measured by the microphone. You can smoothen the graph if you wish by utilizing the IR Graph Tab by various means and them clicking apply. I find the smoothening the graph creates a more consumer friendly representation of the graph that you can also save as an image with the capture button on the top left of the graph (I used that for the graph generated above).

There are also a lot of other settings that I’ve yet to explore with the application that is very useful for reviewing products, such as a waterfall 3D graph I can generate that I can set to display how the frequencies are if I repeat the same audio measurement in different areas of a room for example, as well as a room simulator for audio, and many more that I can also look into when I do a measure, such as delay, distortion as well as phase which I still don’t understand as of now. I’ll be exploring more about the application in the coming days leading to a project, so expect this to be something I’ll be doing more often for my dad as well as on my own here for my product review projects.

